Hausky Simple MA Strategy EURUSD 1HHere is my simple Moving Average crossover strategy for EURUSD 1H
Search in scripts for "moving average crossover"

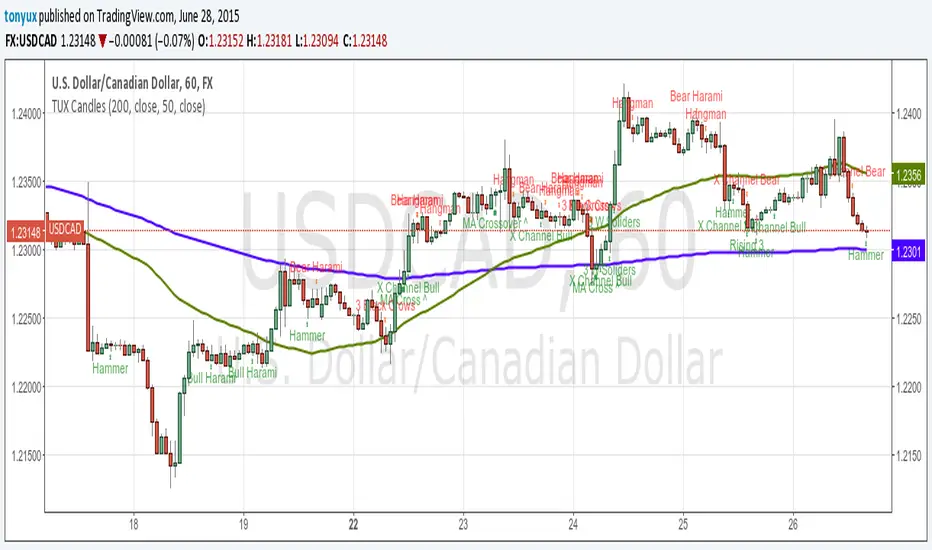
TUX CandlesThis indicator has a lot of information. This is the first version so stay tuned for updates, and please let me know of any bugs.
Candlestick Indicators:
Doji
Shooting Star
Evening Star
Hammer
Hanging Man
Candlestick Formations
Tri-star
Bearish Harami
Bullish Harami
Bearish Harami Cross
Bullish Harami Cross
Bullish Engulfing
Bearish Engulfing
Rising Three
Falling Three
Bearish Abandoned Baby
Bullish Abandoned Baby
Three Black Crows
Three White Soldiers
Technical Indicators:
(You can set you MA periods)
Moving Average Cross
Move Average Crossover
Dual MA Crossover with Profit Targets + Stop-LossChatGPT script and is a dual moving average crossover script with profit targets and stop loss

Dr. Keith Wade Momentum SignalsThis is a heikin Ashli strategy combined with an 18 moving average crossover. Entry at cross of 18 EMA and exit at change of heikin Ashi

CANX MA Crossover© CanxStixTrader
Moving average crossover systems measure drift in the market. They are great strategies for time-limited traders. KEEP IT SIMPLE
This strategy works both for buys and sells using the reaction line to guide your position against the reactions.
HOW TO USE THE INDICATOR
1) Choose your market and timeframe.
2) Choose the length.
3) Choose the multiplier.
4) Choose if the strategy is long-only or bidirectional (longs & shorts).
TIPS
The strategy works best in bullish markets as that is the primary direction that market such as stocks, indexes and metals like to move.
- Increase the multiplier to reduce whipsaws
- Increase the length to take fewer trades
- Decrease the length to take more trades
- Try a Long-Only strategy to see if that performs better.
The base set up when you load the indicator is for the 1 minute chart on gold. We found that it also works well on the US Indexes. For other markets you may need to change the length and multiplier to suit the market and back test its results.


Trend Following with Donchian Channels and MACDThis is a trend following system based on the Donchian Channels. Instead of using a simple moving average crossover, this system uses the MACD as the trendfilter:
Long positions:
* Price makes a new 50 day high,
* The MACD-line crosses above or is above the Signal-line.
* Both the MACD and the Signal-lines are above the zero-line.
Short positions:
* Price makes a new 50 day low,
* The MACD-line crosses below or is below the Signal-line.
* Both the MACD and the Signal-lines are below the zero-line.
Stoploss:
The initial and the trailing stoploss are 4 ATRs away from the price.

Altcoin correlation MeterDear TV'ers,
Hereby a script where the relative strength of an (in this case) altcoin is measured. The script produces a correlation between the altcoin and total altcoin market (Total2 index, see script). Using this script you can see when there is a strong correlation between the two and when there isn't. Moreover, it also produces long/short signals using hull moving average crossover.
Long signals are produced when correlation is below 0 and the hma of the pair is higher than the lagging hma.
Short signals are produced when correlation is below 0 and the hma of the pair is lower than the lagging hma.
Short/Long is closed after correlation is going back towards a set correlation target as well as the Take profit percentage is reached.
In the above example the script is applied to one of my favorite altcoin projects (rose).
Looking forward to feedback/suggestions.

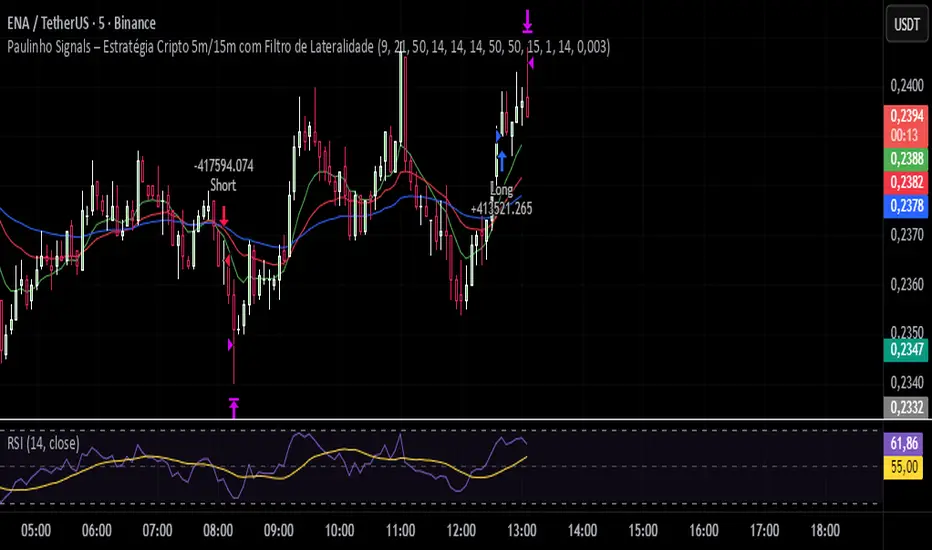
Paulinho Signals – Cripto 5m/15m com Filtro de LateralidadeThis script is an automated Pine Script v6 strategy designed for short-term cryptocurrency trading, especially on 5-minute and 15-minute timeframes. It combines moving average crossovers, trend strength (ADX), volatility (ATR), and candlestick patterns to generate buy and sell signals with a fixed risk/reward management system.
How to Use:
- Apply to cryptocurrency charts on 5m or 15m timeframes.
- Adjust parameters to fit your preferences (EMA, RSI, ADX, ATR).
- Use for backtesting or as a decision-support tool.
Disclaimer:
This script is for educational purposes only and does not constitute financial advice. Always test on demo accounts before applying to live trading.
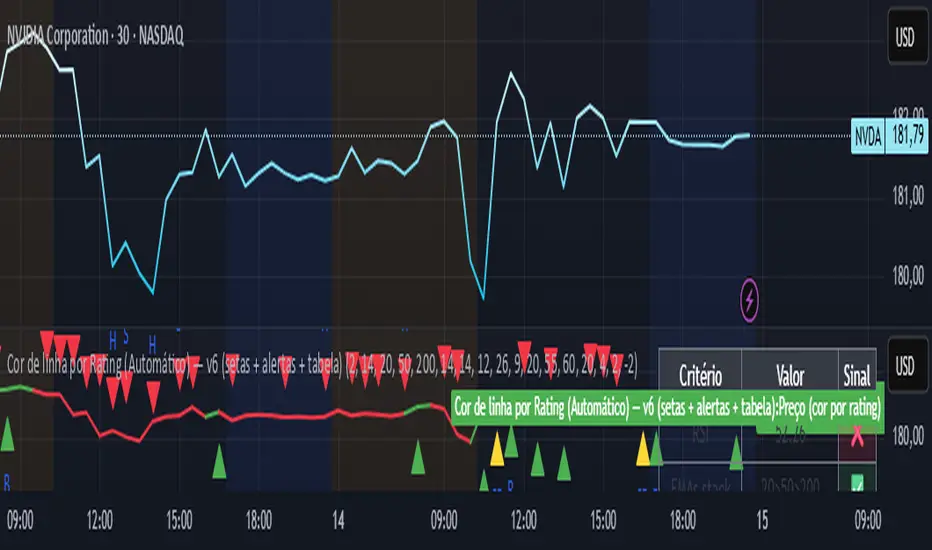
Line color best indices grouped by Artificial Intelligence
The script uses the best buy indicators, such as moving average crossovers, RSI, and others selected by AI. The idea is to determine whether the stock is classified as a strong buy (yellow line), a buy (green line), or a red (sell)
InspireHER Dynamic EMA RR Positioning IndicatorDynamic EMA and RR Positioning Indicator
This indicator is designed to provide traders with highly customizable buy and sell signals based on EMA (Exponential Moving Average) crossovers and Risk-to-Reward (RR) ratios. It works on any timeframe and allows users to toggle price data and additional position boxes for visualizing trade setups. Additionally, traders can choose between displaying dots or labeled signals for buy/sell indicators, making this tool versatile and user-friendly for different preferences and strategies.
What Makes This Indicator Unique
Customizable Parameters: The script offers extensive options for tailoring the indicator to your preferred trading style and strategy:
EMA: Configurable through settings (default is a 21-period EMA).
Risk-to-Reward Ratio (RR): Adjustable to meet your desired RR levels (default is 1:2.5).
Lookback Period: Visualizes buy/sell signals over the last six months.
Position Boxes for Trade Visualization: The indicator can "draw" position boxes on the chart, showing potential entry points, stop-loss (SL), and take-profit (TP) levels based on the selected RR. These visual aids simplify decision-making and help evaluate trade opportunities directly on the chart.
Price Data Toggle: Traders can choose to view or hide price data related to trade signals, including TP, SL, and RR values. By default, this is turned off to maintain a clean chart but can be activated when needed.
Flexible Signal Display Options:
Dots Mode: Displays buy signals as green dots and sell signals as red dots on the chart.
Label Mode: Displays buy signals as labels with the word "Buy" in green and sell signals as labels with the word "Sell" in red.
This toggle allows traders to customize how signals are displayed for a more personalized trading experience.
Simple Signal View: A toggle option provides a cleaner chart by enabling or disabling additional visual elements like circles or labels.
How It Works
Buy Signal: Triggered when the price crosses the EMA and closes above it.
Entry: Top of the candle.
Stop-Loss: Bottom of the candle.
Take-Profit: Calculated based on the selected RR.
Sell Signal: Triggered when the price crosses the EMA and closes below it.
Entry: Bottom of the candle.
Stop-Loss: Top of the candle.
Take-Profit: Calculated based on the selected RR.
Default Settings
EMA: 21-period.
Risk-to-Reward Ratio: 1:2.5.
Price Data: Off (can be toggled on in settings).
Position Boxes: Off (can be toggled on in settings).
Signal Display: Labels mode with "Buy" (green) and "Sell" (red) enabled by default; can be toggled to Dots mode.
Timeframe: Any timeframe supported.
How to Use
Add the Indicator to Your Chart: Once applied, the EMA line and buy/sell signals will appear by default.
Customize Settings: Navigate to the indicator's settings to adjust EMA, RR, or enable/disable Price Data, Position Boxes, or switch between Dots and Label modes.
Trade with Confidence: Use the visual aids and signals to assess trade opportunities based on your strategy and timeframe.
This indicator combines the reliability of EMA-based signals with the flexibility of configurable RR, visual trade setups, and multiple signal display options, making it a powerful tool for all types of traders. Happy Trading!!

Indian Market Sessions for BacktestingThis indicator is designed to increase the quality of your backtesting in the Indian Market.
NSE & BSE run from 9:15 am IST to 3:30 pm IST.
Naturally different times have different kinds of volatility.
On your chart you will find premarked -
Saffron - 9:15 am to 10:30 am - Opening Session - High Volatility Observed Historically
White - 10:35 am to 2:25 pm - Middle Session - Lower Volatility Observed Historically
Green - 2:30 pm to 3:30 pm - Closing Session - Medium to High Volatility Observed Historically
You will also find the start of each session marked with an arrow.
Feel free to change the times from the input settings and the color and visibility from the style settings.
_______________
Usage:
When you backtest any strategies, say moving average crossovers, also mark the sessions in your sheet which will help you further increase accuracy.
Feel free to drop your doubts in the comments.

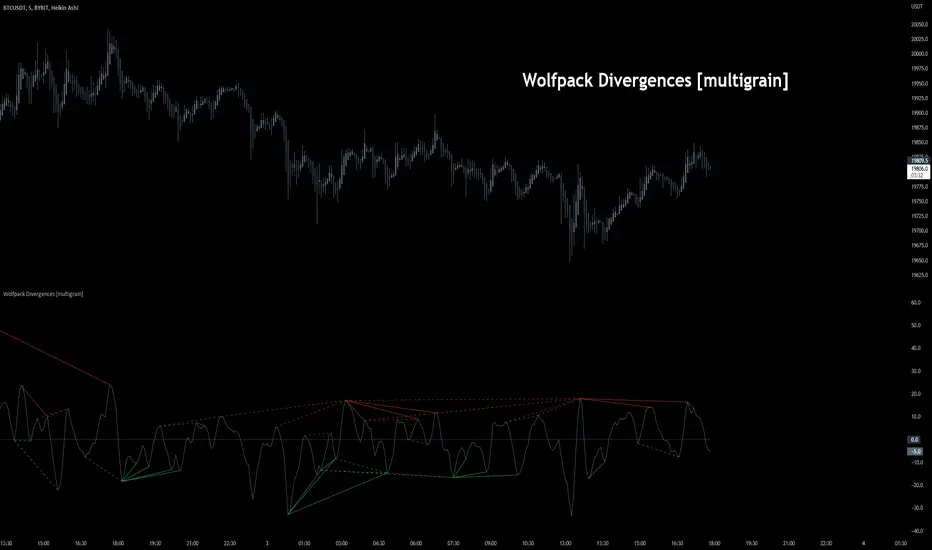
Wolfpack Divergences [multigrain]█ OVERVIEW
A fast and improved divergence finding algorithm that aims to be better than the built-in TradingView divergence algorithm.
█ CONCEPTS
Wolfpack
Wolfpack is an oscillator made popular by darrellfischer1 all the way back in 2017. Since then the Wolfpack oscillator has been utilized by a number of notable strategy/indicator creators. At some point it was realized that the oscillator was simply the Moving Average Crossover Divergence oscillator with the fast and slow length of 3 and 8, respectively. The true significance and reasoning behind these lengths are unknown, however one may surmise that they are chosen due to their relevance as Fibonacci numbers.
Divergences
Divergence is when the price of an asset is moving in the opposite direction of a technical indicator, such as an oscillator, or is moving contrary to other data. Divergence warns that the current price trend may be weakening, and in some cases may lead to the price changing direction.
█ USAGE
Wolfpack
Similar to many other oscillators, when the Wolfpack oscillator reports a value above the zero-line, this indicates a bullish trend in the price. Subsequently, a value below the zero-line indicate a bearish trend in the price.
Divergences
Divergence in technical analysis may signal a major positive or negative price move. A positive divergence occurs when the price of an asset makes a new low while an indicator, such as money flow, starts to climb. Conversely, a negative divergence is when the price makes a new high but the indicator being analyzed makes a lower high.
Open Close Cross Strategy R6.1 revised by yourmattieOriginal version: Open Close Cross Strategy R5 revised by JustUncle.
Change: script changed to a study script with custom alerts.
This revision is an open Public release, with just some minor changes. It is a revision of the Strategy "Open Close Cross Strategy R2" originally published by @JayRogers.
Revised by JustUncleL
Description :
Strategy based around Open-Close Moving Average Crossovers optionally from a higher time frame.
Read more about the indicator original script
Klik here
##USE AT YOUR OWN RISK##
Use this as overlayer on the original strategy to set custom alerts.
Info: with this study script no buy/sell arrows show up op the chart.
Does some know a solution for this issue:
Issue: sometimes it gives a false signal because even when you set "one per bar close" the custom set alert might come halfway the bar....and it might be a false signal when the bar is closed
Does somone know a fix for this? I tried with barstate.iscomfirmed but it didn't work for me.
Ps. I'm not a developer...just changed the scipt by watching a youtube tutorial.
The Best Strategy Template[LuciTech]Hello Traders,
This is a powerful and flexible strategy template designed to help you create, backtest, and deploy your own custom trading strategies. This template is not a ready-to-use strategy but a framework that simplifies the development process by providing a wide range of pre-built features and functionalities.
What It Does
The LuciTech Strategy Template provides a robust foundation for building your own automated trading strategies. It includes a comprehensive set of features that are essential for any serious trading strategy, allowing you to focus on your unique trading logic without having to code everything from scratch.
Key Features
The LuciTech Strategy Template integrates several powerful features to enhance your strategy development:
•
Advanced Risk Management: This includes robust controls for defining your Risk Percentage per Trade, setting a precise Risk-to-Reward Ratio, and implementing an intelligent Breakeven Stop-Loss mechanism that automatically adjusts your stop to the entry price once a specified profit threshold is reached. These elements are crucial for capital preservation and consistent profitability.
•
Flexible Stop-Loss Options: The template offers adaptable stop-loss calculation methods, allowing you to choose between ATR-Based Stop-Loss, which dynamically adjusts to market volatility, and Candle-Based Stop-Loss, which uses structural price points from previous candles. This flexibility ensures the stop-loss strategy aligns with diverse trading styles.
•
Time-Based Filtering: Optimize your strategy's performance by restricting trading activity to specific hours of the day. This feature allows you to avoid unfavorable market conditions or focus on periods of higher liquidity and volatility relevant to your strategy.
•
Customizable Webhook Alerts: Stay informed with advanced notification capabilities. The template supports sending detailed webhook alerts in various JSON formats (Standard, Telegram, Concise Telegram) to external platforms, facilitating real-time monitoring and potential integration with automated trading systems.
•
Comprehensive Visual Customization: Enhance your analytical clarity with extensive visual options. You can customize the colors of entry, stop-loss, and take-profit lines, and effectively visualize market inefficiencies by displaying and customizing Fair Value Gap (FVG) boxes directly on your chart.
How It Does It
The LuciTech Strategy Template is meticulously crafted using Pine Script, TradingView's powerful and expressive programming language. The underlying architecture is designed for clarity and modularity, allowing for straightforward integration of your unique trading signals. At its core, the template operates by taking user-defined entry and exit conditions and then applying a sophisticated layer of risk management, position sizing, and trade execution logic.
For instance, when a longCondition or shortCondition is met, the template dynamically calculates the appropriate position size. This calculation is based on your specified risk_percent of equity and the stop_distance (the distance between your entry price and the calculated stop-loss level). This ensures that each trade adheres to your predefined risk parameters, a critical component of disciplined trading.
The flexibility in stop-loss calculation is achieved through a switch statement that evaluates the sl_type input. Whether you choose an ATR-based stop, which adapts to market volatility, or a candle-based stop, which uses structural price points, the template seamlessly integrates these methods. The ATR calculation itself is further refined by allowing various smoothing methods (RMA, SMA, EMA, WMA), providing granular control over how volatility is measured.
Time-based filtering is implemented by comparing the current bar's time with user-defined start_hour, start_minute, end_hour, and end_minute inputs. This allows the strategy to activate or deactivate trading during specific market sessions or periods of the day, a valuable tool for optimizing performance and avoiding unfavorable conditions.
Furthermore, the template incorporates advanced webhook alert functionality. When a trade is executed, a customizable JSON message is formatted based on your webhook_format selection (Standard, Telegram, or Concise Telegram) and sent via alert function. This enables seamless integration with external services for real-time notifications or even automated trade execution through third-party platforms.
Visual feedback is paramount for understanding strategy behavior. The template utilizes plot and fill functions to clearly display entry prices, stop-loss levels, and take-profit targets directly on the chart. Customizable colors for these elements, along with dedicated options for Fair Value Gap (FVG) boxes, enhance the visual analysis during backtesting and live trading, making it easier to interpret the strategy's actions.
How It's Original
The LuciTech Strategy Template distinguishes itself in the crowded landscape of TradingView scripts through its unique combination of integrated, advanced risk management features, highly flexible stop-loss methodologies, and sophisticated alerting capabilities, all within a user-friendly and modular framework. While many templates offer basic entry/exit signal integration, LuciTech goes several steps further by providing a robust, ready-to-use infrastructure for managing the entire trade lifecycle once a signal is generated.
Unlike templates that might require users to piece together various risk management components or code complex stop-loss logic from scratch, LuciTech offers these critical functionalities out-of-the-box. The inclusion of dynamic position sizing based on a user-defined risk percentage, a configurable risk-to-reward ratio, and an intelligent breakeven mechanism significantly elevates its utility. This comprehensive approach to capital preservation and profit targeting is a cornerstone of professional trading and is often overlooked or simplified in generic templates.
Furthermore, the template's provision for multiple stop-loss calculation types—ATR-based for volatility adaptation, and candle-based for structural support/resistance—demonstrates a deep understanding of diverse trading strategies. The underlying code for these calculations is already implemented, saving developers considerable time and effort. The subtle yet powerful inclusion of FVG (Fair Value Gap) related inputs also hints at advanced price action concepts, offering a sophisticated layer of analysis and execution that is not commonly found in general-purpose templates.
The advanced webhook alerting system, with its support for various JSON formats tailored for platforms like Telegram, showcases an originality in catering to the needs of modern, automated trading setups. This moves beyond simple TradingView pop-up alerts, enabling seamless integration with external systems for real-time trade monitoring and execution. This level of external connectivity and customizable data output is a significant differentiator.
In essence, the LuciTech Strategy Template is original not just in its individual features, but in how these features are cohesively integrated to form a powerful, opinionated, yet highly adaptable system. It empowers traders to focus their creative energy on developing their core entry/exit signals, confident that the underlying framework will handle the complexities of risk management, trade execution, and external communication with precision and flexibility. It's a comprehensive solution designed to accelerate the development of robust and professional trading strategies.
How to Modify the Logic to Apply Your Strategy
The LuciTech Strategy Template is designed with modularity in mind, making it exceptionally straightforward to integrate your unique trading strategy logic. The template provides a clear separation between the core strategy management (risk, position sizing, exits) and the entry signal generation. This allows you to easily plug in your own buy and sell conditions without altering the robust underlying framework.
Here’s a step-by-step guide on how to adapt the template to your specific trading strategy:
1.
Locate the Strategy Logic Section:
Open the Pine Script editor in TradingView and navigate to the section clearly marked with the comment //Strategy Logic Example:. This is where the template’s placeholder entry conditions (a simple moving average crossover) are defined.
2.
Define Your Custom Entry Conditions:
Within this section, you will find variables such as longCondition and shortCondition. These are boolean variables that determine when a long or short trade should be initiated. Replace the existing example logic with your own custom buy and sell conditions. Your conditions can be based on any combination of indicators, price action patterns, candlestick formations, or other market analysis techniques. For example, if your strategy involves a combination of RSI and MACD, you would define longCondition as (rsi > 50 and macd_line > signal_line) and shortCondition as (rsi < 50 and macd_line < signal_line).
3.
Leverage the Template’s Built-in Features:
Once your longCondition and shortCondition are defined, the rest of the template automatically takes over. The integrated risk management module will calculate the appropriate position size based on your Risk % input and the chosen Stop Loss Type. The Risk:Reward ratio will determine your take-profit levels, and the Breakeven at R feature will manage your stop-loss dynamically. The time filter (Use Time Filter) will ensure your trades only occur within your specified hours, and the webhook alerts will notify you of trade executions.

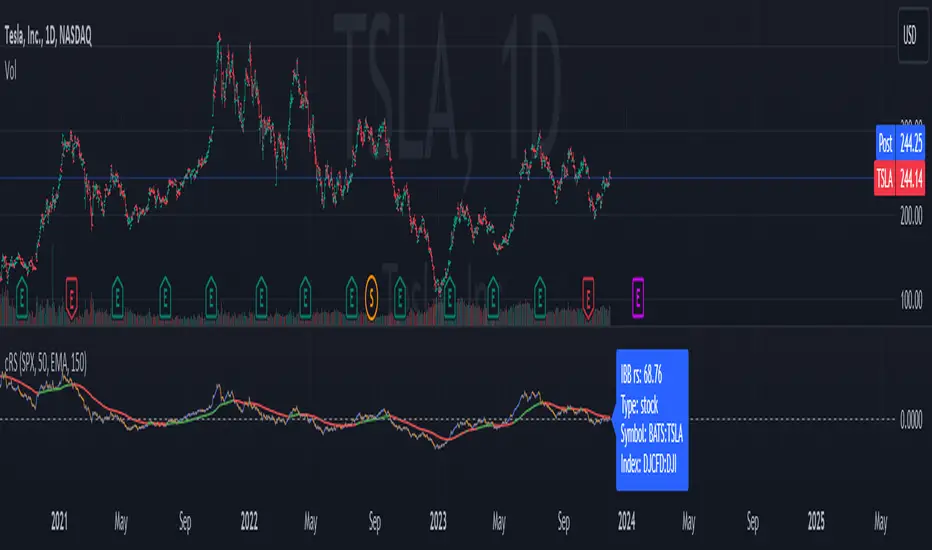
Comparative Relative Strength AutoselectComparative Relative Strength (CRS) is a relative momentum indicator, used to compare a security against an index, or against another security. The comparison is used to show the relative performance to each other.
This script is a Quality of Life improvement, which attempts to match the base symbol to its relevant index on the local stock exchange. Thus automagically selecting the best and most relevant comparative symbol.
Features:
*optional comparative symbol override, in case your favourite index is not included in this script, or you want to force it to function as as a traditional cRS script without the autoselect feature.
* optional moving average crossover line
* optional absolute momentum calculation, calculating the excess return of the basesymbol and comparativesymbol against its own simple moving average.
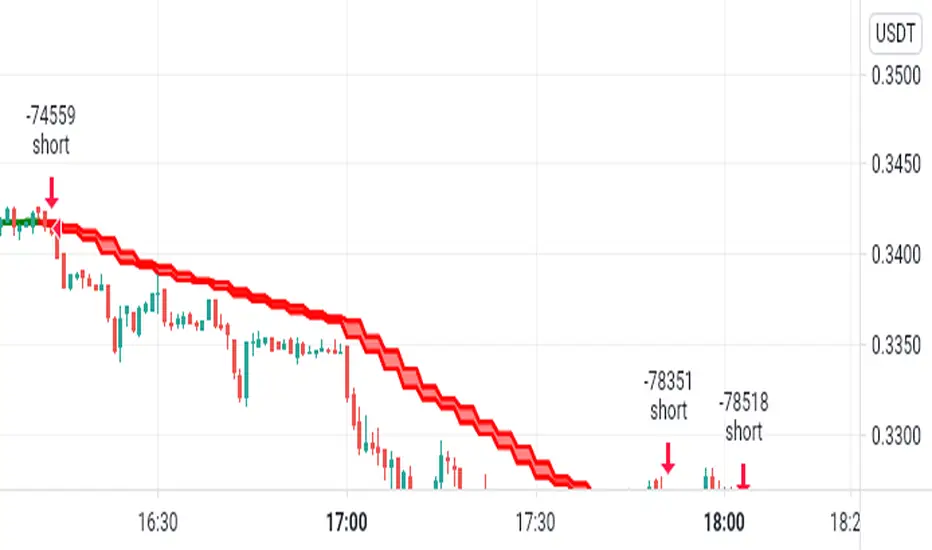
SMACPAC SignalsSimple Moving Average Crossover Price Action Confirmation Strategy
Simply marks key signals or strength and weakness in the chart.
Alerts set up on t.me for SOL/USDT and PEPE/USDT daily charts and more

stockexploderits just for identifying moving average crossover 20 and 50 to identify trend in stocks
easily without taking much time
Supply and DemandThis is a "Supply and Demand" script designed to help traders spot potential levels of supply (resistance) and demand (support) in the market by identifying pivot points from past price action.
Differences from Other Scripts:
Unlike many pivot point scripts, this one offers a greater degree of customization and flexibility, allowing users to determine how many ranges of pivot points they wish to plot (up to 10), as well as the number of the most recent ranges to display.
Furthermore, it allows users to restrict the plotting of pivot points to specific timeframes (15 minutes, 30 minutes, 1 hour, 4 hours, and daily) using a toggle input. This is useful for traders who wish to focus on these popular trading timeframes.
This script also uses the color.new function for a more transparent plotting, which is not commonly used in many scripts.
How to Use:
The script provides two user inputs:
"Number of Ranges to Plot (1-10)": This determines how many 10-bar ranges of pivot points the script will calculate and potentially plot.
"Number of Last Ranges to Show (1-?)": This determines how many of the most recent ranges will be displayed on the chart.
"Limit to specific timeframes?": This is a toggle switch. When turned on, the script only plots pivot points if the current timeframe is one of the following: 15 minutes, 30 minutes, 1 hour, 4 hours, or daily.
The pivot points are plotted as circles on the chart, with pivot highs in red and pivot lows in green. The transparency level of these plots can be adjusted in the script.
Market and Conditions:
This script is versatile and can be used in any market, including Forex, commodities, indices, or cryptocurrencies. It's best used in trending markets where supply and demand levels are more likely to be respected. However, like all technical analysis tools, it's not foolproof and should be used in conjunction with other indicators and analysis techniques to confirm signals and manage risk.
A technical analyst, or technician, uses chart patterns and indicators to predict future price movements. The "Supply and Demand" script in question can be an invaluable tool for a technical analyst for the following reasons:
Identifying Support and Resistance Levels : The pivot points plotted by this script can act as potential levels of support and resistance. When the price of an asset approaches these pivot points, it might bounce back (in case of support) or retreat (in case of resistance). These levels can be used to set stop-loss and take-profit points.
Timeframe Analysis : The ability to limit the plotting of pivot points to specific timeframes is useful for multiple timeframe analysis. For instance, a trader might use a longer timeframe to determine the overall trend and a shorter one to decide the optimal entry and exit points.
Customization : The user inputs provided by the script allow a technician to customize the ranges of pivot points according to their unique trading strategy. They can choose the number of ranges to plot and the number of the most recent ranges to display on the chart.
Confirmation of Other Indicators : If a pivot point coincides with a signal from another indicator (for instance, a moving average crossover or a relative strength index (RSI) divergence), it could provide further confirmation of that signal, increasing the chances of a successful trade.
Transparency in Plots : The use of the color.new function allows for more transparent plotting. This feature can prevent the chart from becoming too cluttered when multiple ranges of pivot points are plotted, making it easier for the analyst to interpret the data.
In summary, this script can be used by a technical analyst to pinpoint potential trading opportunities, validate signals from other indicators, and customize the display of pivot points to suit their individual trading style and strategy. Always remember, however, that no single indicator should be used in isolation, and effective risk management strategies should always be employed.

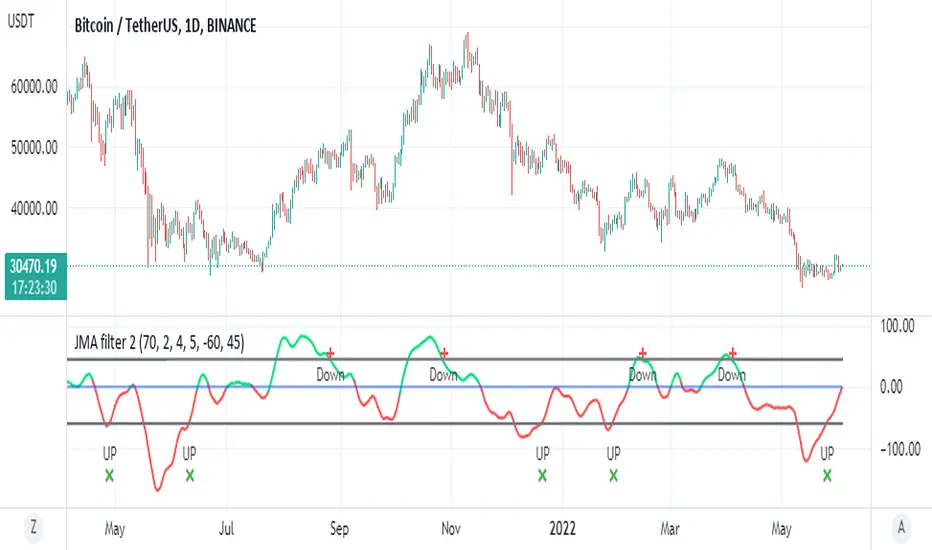
JMA filter 2This is based on ChuckBanger Juric indicator (a modification of it)
things you need to know how to work with this one
to control the wave setting you need to adjust the length , slow ,fast and c in menu for optimal result
positive trend is above zero in green
negative trend bellow zero red
the best part herein this indicator is to finding of high and low based on lower treshold =trel
higher threshold for high =treh
there is signals once it crossed up or down
for each time frame you need to set the threshold for optimal results as it change for each TF it will be different so be careful about it
so rule of thumb is to look for the previous peaks either up or down and to set the threshold according to it
it more sensitive then RSI to my opinion and very good to detect sweet spot either for sell or buy
one can add alerts (not included)
or modify it to make it better
here on Tesla
TICK strategy for SPY optionsImportant notes:
1. This strategy is designed for same day SPY option scalping. All profit shown in back testing report is based on Profit/Loss (P/L) estimates from trading options with approximately 6 months of data. By default, it is set to 10 option contracts. By default the initial capital is set to $5000. Pyramiding is set to 3.
2. This strategy works better with non-extended market data.
3. This strategy is mainly developed for SPY trading on 5 min chart, it probably will not be very profitable with other tickers or time frame without tweaking all the parameters first.
4. This strategy will work with QQQ as well, but please adjust the profit multiplier to match the P/L of QQQ options.
How it works:
When trading the indices, many rely on the TICK for market directions. This strategy is a trend following strategy that uses a combination of conditions using the following indicators:
- TICK
- RSI
- VIX volatility index
- EMA
For entries, the conditions are:
1. TICK moving average crossover with a delayed signal line
2. Bullish or bearish RSI signal, RSI > 50 for bullish, < 50 for bearish
3. VIX must be above a certain threshold to take advantage of high market volatility
4. Price must be on top of EMA line for long, and below for short
For exits, there are 3 scenarios:
1. Stop loss set by a percentage of the daily ATR value
2. Trend changes on the TICK and the RSI
3. Bearish or bullish divergence on price with TICK
This strategy automatically signal to close all trades at 3:50 pm EST at the end of the day.
Extras:
- There is an option to show P/L for reinvesting profits
Enjoy~!!! Let's all make $$$

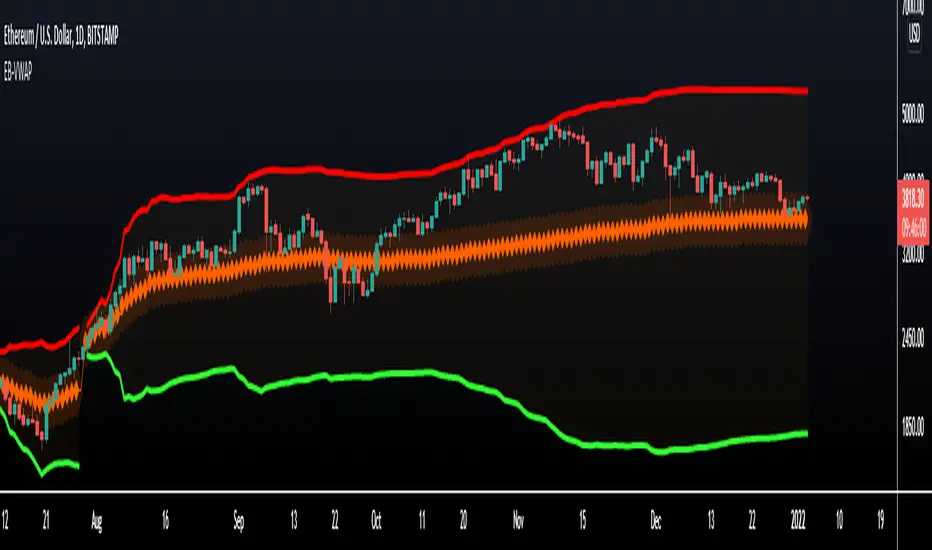
VWAP Bands - Event Based [LuxAlgo]This indicator returns VWAP bands with a degree of smoothness resetting based on various user-selected events. The bands are constructed using a VWAP based naive standard deviation.
The indicator can be anchored or start from the first bar and can be used as trailing support/resistance, in a moving average crossover system, or as source for external indicators.
Settings
Start: VWAP anchor point
Start At First Bar: Display the VWAP from the first bar instead of a specified anchor point
VWAP
Length: Controls certain characteristics of the user-selected event
Mult: Multiplicative factor for the VWAP standard deviation
Source: Price source of the indicator
Event
Event: Determines the event resetting the degree of smoothness of the VWAP
External Cross/Event: Input source used for external crosses/events
Further details about the available events are given below.
Details
Various event conditions are available to the users. When the selected event occurs, the VWAP equals the current closing price.
By default, the event is periodic, that is the VWAP resets periodically, with a period determined by the Length setting.
The Higher High event resets the VWAP when a new higher high occurs.
The Lower Low event resets the VWAP when a new lower low occurs.
The Trend Change event is similar however resets the VWAP only once a higher high or lower low occurs. Higher highs and lower lows are given by Donchian channels with a period determined by the Length setting.
The Start event reset the VWAP at the selected anchor point (or first bar if the "Start At First Bar" setting is selected). This can be useful if one only needs a regular anchored VWAP band indicator.
The External Cross event resets the VWAP when the Source price crosses the series selected in the External Cross/Event setting. In the image above the VWAP resets when the price crosses the volatility stop indicator.
The External Event resets the indicator when a series selected in the External Cross/Event setting is not equal to 0. This allows using a custom event in order to reset the VWAP. In the above example the VWAP is reset during a new session due to the External Session indicator.